LiDAR Improves Our Understanding of Landslide Risk
Geologists Karl Wegmann and Corey Scheip used LiDAR data to investigate the water flow pattern below high energy debris flow.
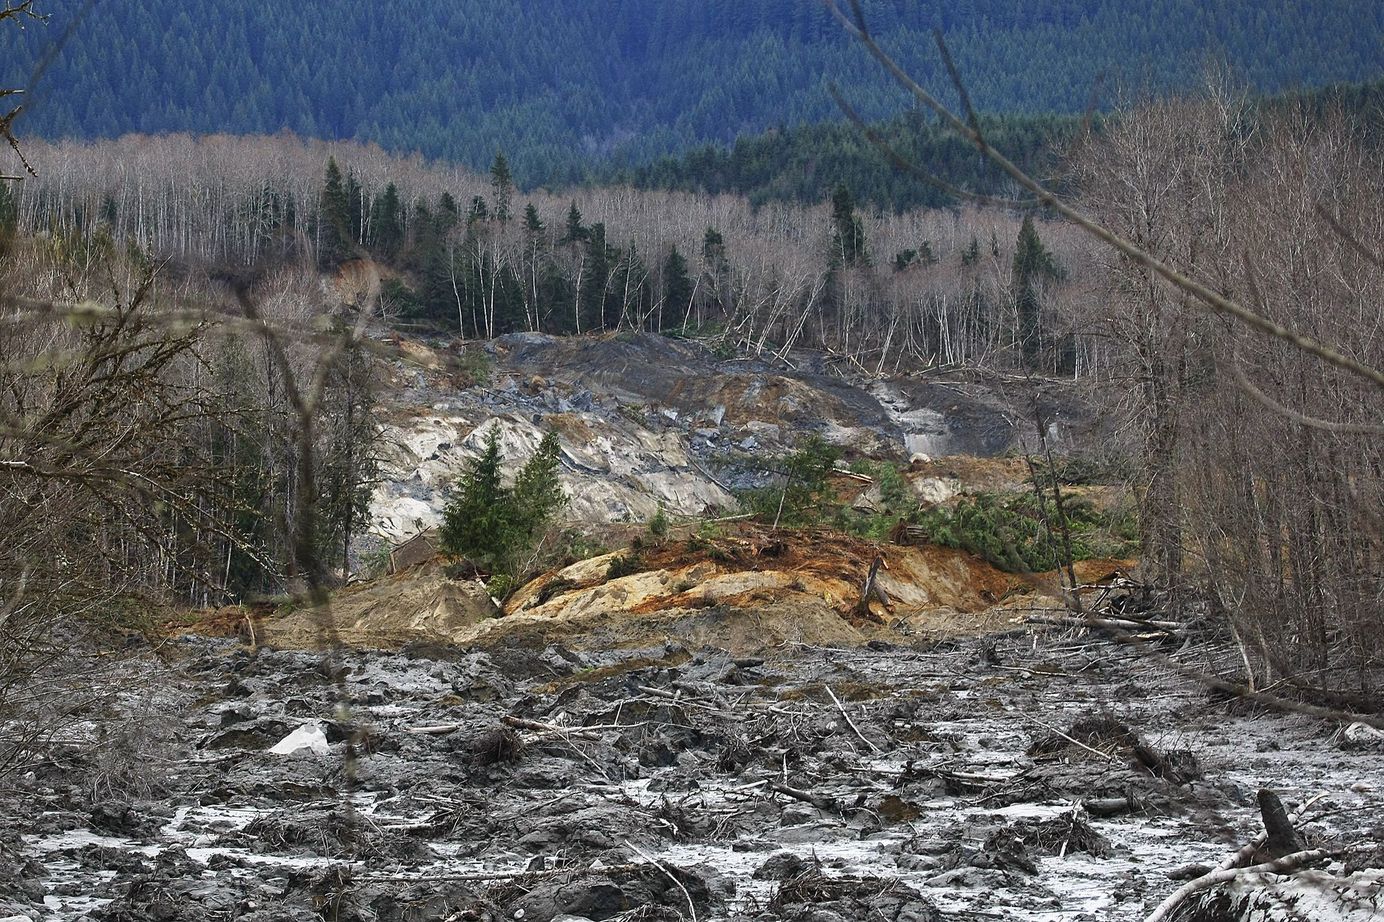
Landslides are a serious threat in the North Carolina mountains. A landslide is triggered when the wet soil on a mountaintop "unsticks," and what begins as a modest landslide may rapidly grow into a massive debris flow that uproots trees and dislodges rocks, destroying everything in its path as it rushes downward at rates of up to 30 miles per hour.
The cost may be astronomical, both in terms of property and human life.
Understanding the possible hotspots for such catastrophic waste events seems like a valuable endeavour, especially given the random nature of such catastrophes. Then along came LiDAR and geologists like Karl Wegmann and Corey Scheip, a former Ph.D. student at North Carolina State University.
South of Asheville, in the Blue Ridge Mountains, Scheip and Wegmann investigated a landslide in 2018. There were 240 different landslides and debris flows caused by the storm, which poured up to six inches of rain in three hours.
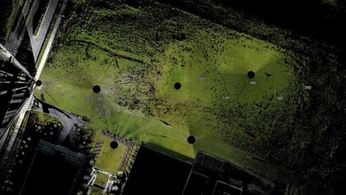
“We were fortunate because North Carolina is a leader in having the entire state surveyed with very high-resolution LiDAR topography data,” Wegmann says. “And we had LiDAR data from both before and after the event, so we were able to calculate what got displaced and how.”
STAY ON TOP OF THE NEWS
Join the free newsletter to receive the latest updates in your inbox.
Geologists have traditionally estimated landslide risk by examining the amount of debris flow after an occurrence and attempting to pinpoint its source.
“Essentially, we calculated the contributing drainage area,” Wegmann says. “If you look at every meter of the landscape above the debris flow and estimate where water is likely to collect, you can calculate where you may get enough water to create a triggering landslide, that if it is directed into a stream channel, very likely may transition into a fast-moving and damaging debris flow event.”
The material transport rate along the debris flow channel was also studied by the researchers using LiDAR. This is the amount of "stuff" that is transported from the beginning to the end of the debris flow. Unexpectedly, they discovered that erosion is not comparable to deposition.
“In a perfect world, a debris flow starts, flows down a track, and everything piles up at that bottom,” Wegmann says. “So, in theory, the same amount that erodes off of the hillslope deposits at the bottom. However, we found that only about 70% of the material ends up at the bottom. That means 30% is moved into a river and washed out of the system.”
In order to estimate and anticipate the behaviour of debris flows, it is crucial to know how much material is really going downslope. This includes how quickly the flows will take up additional material, how large they will become, and how far they will travel.
Using this data, geologists can predict where runoff or deposits would occur.
“Most houses are built at the foot of valleys,” Wegmann says. “This data could give builders and planners the ability to look at topography and determine less hazardous places to build.”
This article was published in the March 12, 2022 edition of Landslides.
ARTICLE ABSTRACT
How debris flows erode and deposit material along their paths is difficult to determine in natural settings due to the lack of warning and the rapid pace at which they occur.
Post-event field measurements or controlled flume experiments are commonly used to evaluate debris flows between the head and the distalmost deposit.
Increasingly available high-resolution lidar data provide another means to evaluate the entrainment and deposition of material during a debris flow.
This study utilizes submeter lidar before and after a debris flow event in Polk County, North Carolina, to evaluate for volumetric growth and decay of 54 rainfall-triggered debris flows that occurred during a convective storm on May 18, 2018.
Debris flow evolution can be characterized by three discrete phases when viewed according to a volume-distance plot: (1) the initiating debris slide, (2) the entrainment phase, and (3) the depositional phase.
The rate of debris flow growth is highest during the first phase, nearly linear during the second, and negative during the third phase. When normalized by distance along the flow, the growth rate decays according to a power law 𝐸=𝑎𝑋𝑏E=aXb (𝑟2≥0.97r2≥0.97).
This new power law relationship may indicate differences in initiating landslide process and should be leveraged in future runout modeling studies.
Find the article here:

LiDAR INSIGHTER Newsletter
Join the newsletter to receive the latest updates in your inbox.


