
Visualizing LiDAR Data in 3D Made Easy with One Line of Code
Learn how to easily visualize LiDAR data in 3D using just one line of code. This article provides step-by-step instructions and highlights different visualization methods for LiDAR data analysis.
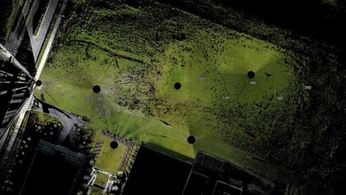
LiDAR (Light Detection and Ranging) technology has become increasingly important in various fields, such as forestry, urban planning, and autonomous vehicles. This article explores the process of visualizing LiDAR data in 3D to gain valuable insights.
LiDAR data consists of laser beams that are emitted and reflected back to a sensor, providing highly detailed information about the environment. Before visualizing the data, the article first explains how to read the key components of LiDAR data, such as the LAS header, the number of points, and the list of features.
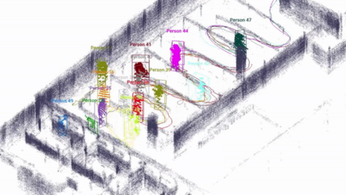
The article then introduces four different Python backends - pyvista, ipygany, panel, and open3d - that allow for easy visualization of LiDAR data. Each backend is explained, and the step-by-step process of visualizing LiDAR data using that specific backend is provided.
The practical applications of visualizing LiDAR data in 3D are numerous. For example, in forestry, it can help analyze tree heights and spacing, leading to better forest management strategies. In urban planning, it can assist in assessing building heights and terrain profiles. In autonomous vehicles, it can contribute to the development of accurate 3D maps for navigation.
The article emphasizes the significance of LiDAR technology in various industries and its potential to revolutionize how we understand and interact with our environment. By visualizing LiDAR data in 3D, professionals can make informed decisions and obtain valuable insights.
In conclusion, visualizing LiDAR data in 3D has never been easier. With just one line of code, users can unlock the potential of LiDAR data for a wide range of applications. Stay tuned for further advancements and innovations in LiDAR technology.
LiDAR INSIGHTER Newsletter
Join the newsletter to receive the latest updates in your inbox.
